Ask any operator who the biggest players in their market are, and you’ll get a rough guess. A handful of names. Some conference hearsay. Nobody has had the actual data.
Until now.
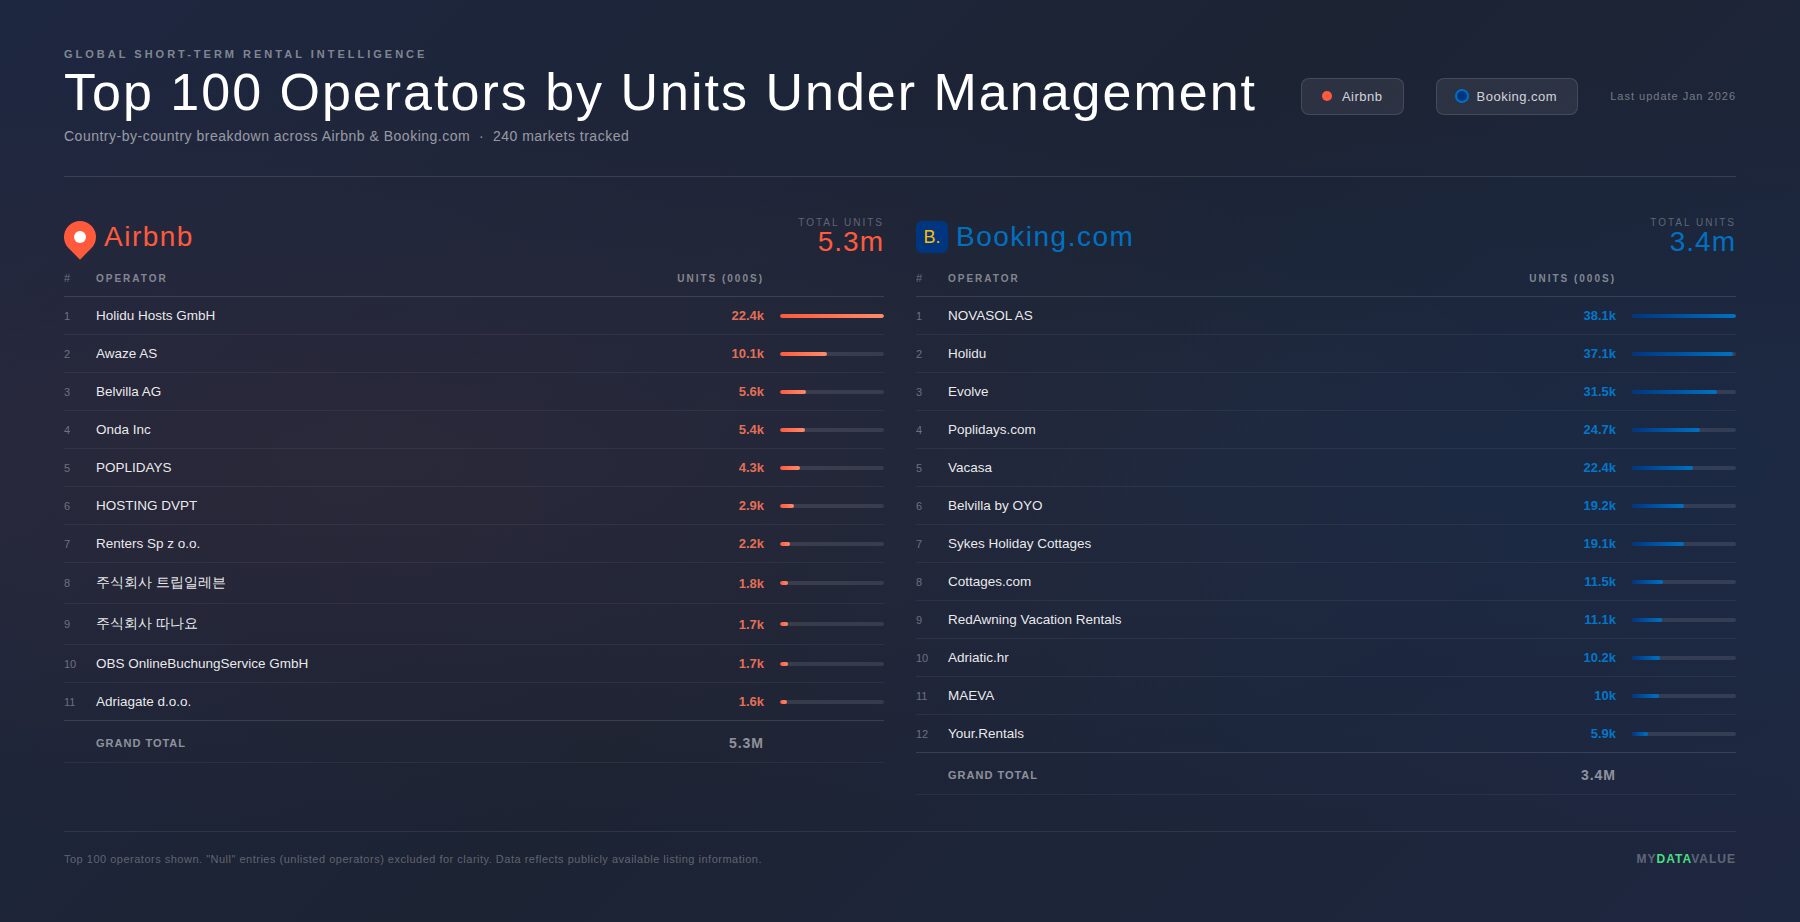
The Dataset
Last month we scanned every advertised listing on Airbnb and Booking.com across 240 countries:
- 5.3M on Airbnb (~500k stale listings excluded — closer to 5.8M total)
- 3.4M on Booking.com
- 8.7M vacation rentals mapped globally
That gave us the listing-level picture. This article is about the next layer: mapping those 8.7 million listings back to the operators behind them.
We have built a free interactive dashboard that ranks the top 100 operators worldwide — and you can filter it by country to see exactly who dominates your market.
What You Can Do With the Dashboard
The dashboard is live and free. No sign-up.
→ Filter by country — see the top 100 operators in any market → Filter by platform — Airbnb only, Booking.com only, or combined → Sort by portfolio size — understand how concentrated or fragmented a market really is → Benchmark yourself — see where your portfolio sits relative to the largest operators in your region → Export data — pull the numbers directly from the charts
This is the first time operator-level data at this scale has been made publicly available in the vacation rental industry.
What We Found
Market concentration varies dramatically
In some countries, the top 10 operators control a serious share of total listings. In others, the top 100 barely make a dent — the market is deeply fragmented with thousands of small operators. This distinction matters: your pricing strategy, your channel mix, and your competitive position all depend on which type of market you are operating in.
Globally, listings are split roughly 56% Airbnb and 44% Booking.com. But the top operators in any given market often have a very different distribution profile. Some lean heavily into Booking.com. Others are Airbnb-first. Knowing where the large players concentrate their inventory tells you something important about where the bookings actually flow.
This is not an apples-to-apples comparison — and here is why
Booking.com and Airbnb structure their inventory in fundamentally different ways, and this matters when you read the numbers.
On Booking.com, the hierarchy is building → room type → unit. A 50-unit aparthotel is one listing (one building) on Booking.com, with room types and individual units sitting underneath it. The guest books a room type within that building.
On Airbnb, the same 50-unit aparthotel would typically appear as 50 separate listings — one per unit. Each unit has its own page, its own calendar, its own reviews.
That means the 3.4M Booking.com figure significantly understates the platform’s true bookable inventory. A single Booking.com listing can represent dozens or even hundreds of bookable units. On Airbnb, each of those units inflates the listing count individually.
This is especially relevant for the hotel and aparthotel segment. Airbnb has only recently started advertising hotels on its platform, and they appear as individual unit listings. Booking.com has had hotels for decades — but they sit within the building structure and count as one listing regardless of how many rooms they have.
The practical implication: the real gap between Airbnb and Booking.com in bookable inventory is much smaller than 5.3M vs 3.4M suggests — and in some markets, particularly in Europe where Booking.com has deep hotel penetration, the platform may actually have more bookable units than Airbnb despite showing fewer listings.
When you look at the top 100 operators on the dashboard, keep this in mind. An operator with 200 Booking.com listings could be managing thousands of units behind those listings. An operator with 200 Airbnb listings is managing closer to 200 units.
Europe is tighter than the global numbers suggest
In France, Italy, Spain, and the UK, Booking.com is much closer to parity with Airbnb than the global headline number implies. Operators in those markets who are only optimising for one platform are leaving revenue on the table. The data makes this very clear at the operator level.
Southeast Asia and the Middle East are the fast movers
Both platforms are growing quickly in these regions. The operators establishing scale there now will set the benchmark for the next three years.
Why This Matters
Most revenue management conversations are about pricing. That is the starting point — but it is not the full picture.
If you manage 80 listings in Barcelona, you are not just competing on price. You are competing for search visibility against operators running 400+ listings in the same city. They have different platform relationships. Different rate plan access. Different promotion eligibility. They show up in searches you are being filtered out of.
You cannot benchmark yourself against competitors you cannot see. This dataset makes them visible.
How We Gathered the Data
Direct scanning of advertised listings on Airbnb and Booking.com — not third-party aggregators, not surveys, not platform-disclosed figures.
Every listing was active and advertised at the time of the scan. Stale listings (no calendar activity, no recent reviews) were flagged and excluded from active counts.
Operator matching was done by cross-referencing property management company names, host account patterns, listing URLs, and portfolio clustering. We applied conservative matching — if we were uncertain whether two listings belonged to the same operator, we kept them separate.
A Note on Data Quality
This dataset is not fully matched and cleaned. The operator-level matching is an ongoing process — some operators manage listings under multiple brand names, some use different host accounts across platforms, and some portfolio structures are not straightforward to cluster automatically.
The top 100 ranking should be treated as directionally accurate rather than a precise legal entity count. Large operators with fragmented branding may be slightly undercounted. Some smaller operators may appear higher than their true position if a competitor’s listings are split across multiple unlinked accounts.
We are actively cleaning and validating the data country by country. Each release will improve on the previous one as we refine the matching logic and incorporate feedback from operators who know their markets.
This is transparency, not a caveat. The data is useful now — and it will get better.
What Is Coming Next
This is the first release.
Over the coming months, we are expanding to the top 200–300 operators per country — a much deeper view of market structure in each geography. Country-level datasets will be released as they are cleaned and validated, starting with the largest markets.
We are prioritising data quality over speed. Each country dataset will be reviewed before it goes live. If there is a specific country you want us to prioritise, let us know.
Acknowledgements
A big thanks to the team at Scale Rentals for the ongoing content partnership. Publishing data-driven research like this would not have the same reach without their platform and community. This is the second release from our partnership and there is plenty more in the pipeline.
Get the Dashboard
Comment “operators” and we will send you the link to the free interactive dashboard.
Filter by country, sort by platform, export the data. It updates as the dataset is refreshed.
Data: March 2026, direct scan of Airbnb and Booking.com listing pages across 240 countries. 8.7M listings mapped (5.3M Airbnb, 3.4M Booking.com). Operator matching via company name, host account, and portfolio clustering. Provided by myDataValue in partnership with Scale Rentals.
This article is part of an ongoing content partnership between myDataValue and Scale Rentals — data-driven research for vacation rental operators, published on The Wire.